

Mark has been running fuel operations for eleven years.
He manages a petroleum distribution company in the Southeast. Around $90M in annual volume. Twenty-two trucks. Four terminals. A dispatch team that runs tight and a billing team that rarely misses an invoice.
Mark is good at his job. His customers don’t leave. His drivers don’t quit. His DSO is the lowest it has been in three years.
And every single month, his inventory reconciliation comes in slightly off.
Not dramatically off. Not enough to trigger a formal investigation. Just off. A few hundred gallons here. A couple thousand dollars there. Within what the operation loosely calls acceptable tolerance.
For the first two years he dug into it. Chased variances back to specific loads. Called terminals. Questioned drivers. Ran the numbers three different ways.
He never found a clean answer.
So at some point, without making a formal decision about it, he stopped looking.
The variance became a line item. Then it became background noise. Then it stopped being something anyone on his team asked about.
Mark is a composite of several operators I have spoken with. But the pattern is real.
That quiet decision is one of the most expensive ones a fuel distributor makes. Not because the individual variance is large. Because it compounds every single month while nobody is looking for it.
What acceptable variance actually means
Regulatory and internal tolerance thresholds vary widely by state, storage type, product, and operating model. But in most fuel operations, variance that falls inside an accepted monthly tolerance does not trigger serious investigation.
That is the dangerous part.
Acceptable often becomes ignored.
A mid-market distributor moving 10 million gallons a year is operating on roughly $35M in product value at $3.50 per gallon. At 1% variance that is 100,000 gallons a year. At $3.50 per gallon that is $350,000 in product value moving through a variance line annually.
That does not automatically mean $350,000 was lost. Some variance is measurement-related. Some is timing. Some is temperature. Some is product in transit. Some is real operational loss.
But if the operator cannot explain the variance, the business is carrying a blind spot worth hundreds of thousands of dollars.
Mark’s operation moves around 8 million gallons annually. His variance has been running at roughly 0.4% for the past eighteen months. On 8 million gallons that is 32,000 gallons a year. At $3.50 per gallon that is $112,000 in product value moving through his books without a clean operational explanation.
He knew the percentage. He had never translated it into dollars.
Most mid-market distributors haven’t.
They know whether last month’s reconciliation was better or worse than the month before. They do not have a rolling twelve-month variance view by terminal, product, driver, truck, compartment, and customer.
Without that visibility, the slow leak is invisible.
Where inventory variance actually comes from
Inventory variance in fuel distribution is not random. It comes from consistent, repeatable, traceable places. You just need the system to show you where to look.
Meter calibration drift.
Truck meters are certified and recalibrated on a schedule. Between calibrations, meters can drift. A meter reading 0.2% high on every delivery creates a small mismatch on every load. The customer received 998 gallons. The system says 1,000. The invoice reflects 1,000. The money may have been collected but the inventory record is now wrong.
Mark had a truck running a meter 0.3% high for four months before recalibration surfaced the issue. By the time anyone connected the meter to the reconciliation variance, the accumulated discrepancy was 6,200 gallons. At $3.50 per gallon that was $21,700 in product value recorded incorrectly. The money wasn’t necessarily lost. But the inventory record was wrong for four months and nobody knew why.
Bad inventory records create bad decisions.
Temperature correction inconsistencies.
Fuel volume changes with temperature. Terminal BOLs may show both gross and net gallons. Customer billing may use gross, net, or contract-specific rules depending on product, state, and operating practice. If those rules are not applied consistently across dispatch, BOL, delivery, invoice, and accounting, variance accumulates quietly.
This is especially true when one system holds the BOL, another creates the invoice, the driver app captures delivered gallons, and accounting only sees the final number.
The variance is not always in the fuel. Sometimes it is in the handoff.
Compartment heel.
When a truck delivers a partial load, product remains in the compartment. That heel gets carried to the next delivery. If it is not tracked and reconciled against the next load, it creates a floating inventory discrepancy that moves around the fleet until someone finds it or writes it off. In operations running split loads across multiple product types, heel tracking is where a lot of variance lives.
The product is not gone. The system just does not know where it is.Load splitting that does not reconcile cleanly.
A driver is dispatched with 8,500 gallons for three customers. One customer takes less than ordered. The driver splits the remaining product to a fourth customer added mid-route. The original dispatch record, terminal BOL, driver delivery confirmation, and invoice no longer tell the same story.
Somewhere in that handoff, gallons start to drift. Not because someone made a huge mistake. Because the system was not built to reconcile the operational reality of the route.Shrinkage and spillage.
Product is lost during loading, unloading, equipment maintenance, spills, and normal field operations. Some of it is unavoidable. All of it should be categorized. When shrinkage gets buried inside a catch-all variance entry, the underlying cause stays hidden and the loss repeats.
None of these are dramatic in isolation. Each one looks like measurement error, rounding, or normal operational noise. Together, across a fleet and a full year of deliveries, they become a real number.
Not all variance is a loss
This is where the conversation gets more interesting than most variance articles let it.
Most people talk about inventory variance like it is always bad. It is not.
Variance can be negative. Variance can also be positive.
An owner of a large Texas-based fuel marketer shared his numbers when I asked about variance thresholds.
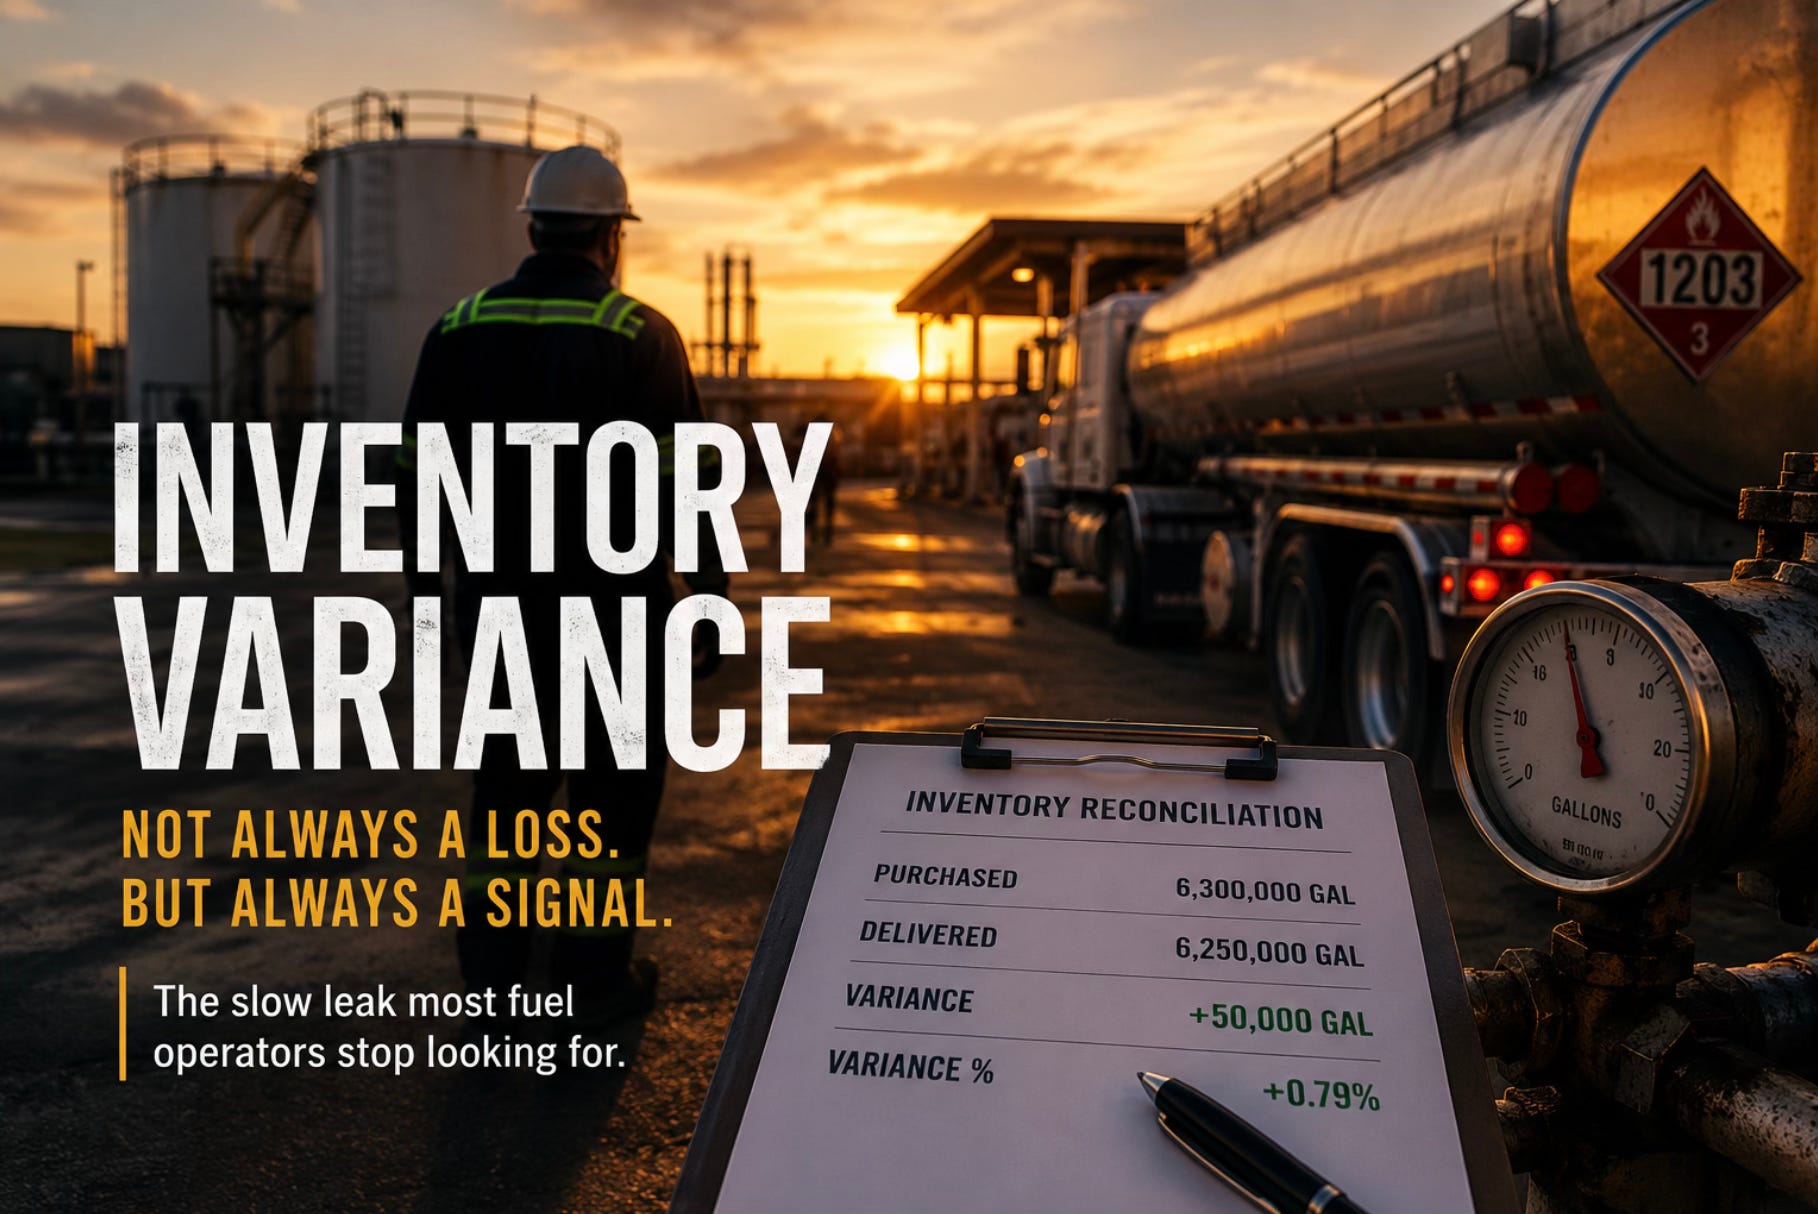
His operation runs a 1.4% tolerance in either direction. Last month they wrote on 50,000 gallons against 6.3 million gallons purchased. Not a loss. A gain. Roughly 0.8% positive variance.
In Texas, summer heat changes the equation. Fuel expands. Depending on how the operation buys, stores, delivers, meters, and bills fuel, expansion can create a positive inventory impact. In his case, after accounting for shrinkage and operating reality, the estimated annual impact was around $750,000.
That number surprised him when he calculated it. He had never looked at variance that way before.
The point is not that variance is always good or always bad. The point is that most fuel distributors don’t know which direction their variance runs or what it is worth in dollars.
Climate matters. A distributor in Texas is playing a different variance game than one in Minnesota. Summer heat can create expansion gains. Cold climates can create contraction losses. The direction changes. The principle does not.
Variance is not the problem. Unexplained variance is the problem.
The reconciliation that happens too late
Most mid-market fuel distributors reconcile inventory monthly. Some do it weekly. Very few do it close to real time.
Monthly reconciliation means variance accumulates for 30 days before anyone looks at it. By the time the numbers are reviewed, the loads that created the variance have been delivered, invoiced, and closed. The driver who split the load mid-route doesn’t remember the exact details. The dispatch record may not reflect what actually happened in the field. The BOL has been scanned, uploaded, and filed. The invoice has already gone out.
Monthly reconciliation doesn’t catch variance. It counts it after the fact.
A distributor moving 800,000 gallons a month with a 0.4% variance rate is carrying 3,200 gallons a month in unexplained variance. At $3.50 per gallon that is $11,200 a month. Over a year that is $134,400. Caught in real time, some of that variance is explainable or recoverable. Caught thirty days later, most of it becomes a note in the monthly report.
Mark’s team runs reconciliation on the last business day of the month. It takes two people most of the day. The output is a number that goes into a variance line and a note that says inventory was within acceptable range.
Nobody on his team had asked what acceptable range was actually worth in dollars. Until now, neither had Mark.
The variance nobody talks about: product in transit
There is one category of inventory variance that rarely shows up cleanly in reconciliation reports.
Product in transit.
At any given moment, a fuel distributor has product sitting inside truck compartments between the terminal and the customer. That product has left terminal inventory. It has not yet been confirmed as delivered. It exists in a state that most systems do not track cleanly.
If a driver ends his shift with product still in the compartment, that product needs to carry forward to the next day’s inventory. In operations where end-of-shift inventory is manual, inconsistent, or skipped entirely, that product disappears from the books until the next delivery creates a record.
Mark runs twenty-two trucks. If each truck carries an average heel of 200 gallons at end of shift, that is 4,400 gallons floating in transit inventory on any given night.
At $3.50 per gallon that is $15,400 in product value the system cannot account for.
The product exists. The question is whether the system knows where it is.
What clean fuel operators do differently
The best operators have not eliminated variance. That is not the goal. They have made variance visible at the right level of detail. They know which variances to investigate, which ones to explain, and which ones to accept.
Three things separate them from the operations still writing off monthly variance as background noise.
They reconcile by transaction, not just by period.
Every load is reconciled at the point of delivery. Dispatched gallons. Loaded gallons. BOL gallons. Delivered gallons. Invoiced gallons. Truck inventory movement. The variance on that specific load is visible before the next load moves.
Patterns emerge quickly. A specific truck compartment running consistently high. A specific terminal where BOL and invoice volumes don’t match. A specific driver whose delivery confirmations consistently show variance above fleet average. A specific customer where ordered gallons and delivered gallons are constantly misaligned.
The key is not only seeing the monthly number. The key is knowing which transaction created it.They track product state continuously.
Terminal inventory. Truck inventory. In-transit inventory. Delivered but not yet confirmed inventory. Each state is tracked separately and each movement is recorded when it happens. Monthly reconciliation becomes a validation step, not a discovery process.
They separate measurement variance from operational variance. A 150-gallon variance on a 10,000-gallon load explained by temperature correction is different from a 150-gallon variance with no explanation. The first may be normal. The second needs investigation. Operations that lump both into the same write-off line never build the pattern recognition needed to manage inventory well.
The goal is not zero variance. The goal is knowing where every gallon went and having a defensible explanation for every variance above your threshold.
The question worth asking this week
Pull your last twelve months of inventory reconciliation reports. Then calculate five numbers:
Total monthly purchased gallons
Total delivered gallons
Net inventory variance by product
Variance by truck or compartment
Variance by terminal or supply source
Then ask three questions:
How much of the variance was investigated? How much was traced to a specific source? How much was written off as a catch-all entry?
If the answer to the last question is “most of it,” you do not have a variance problem. You have a visibility problem.
The gallons are not random. They went somewhere. And in some climates, they came back with friends.
Mark did the math after our conversation. His 0.4% variance rate on 8 million gallons at $3.50 per gallon represented $112,000 a year in unexplained product value.
He had never run that number before.
He is running it now.
Next issue: Why fuel marketers need simpler systems, not more software noise.
About the author
I’m Dibyesh G., founder of Fueleo. I spend my time working with fuel marketers on the messy handoffs between pricing, dispatch, delivery, BOLs, invoicing, inventory, and accounting. This newsletter is where I write about the operational problems hiding inside everyday fuel workflows.